|
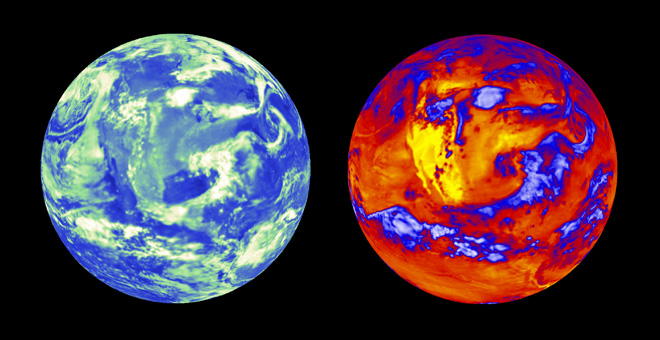
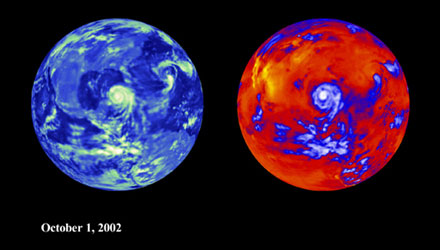
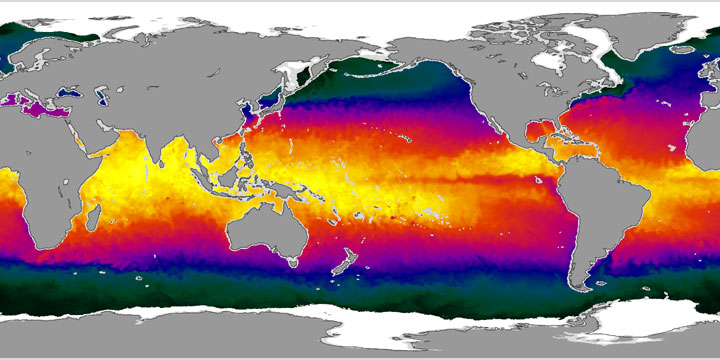
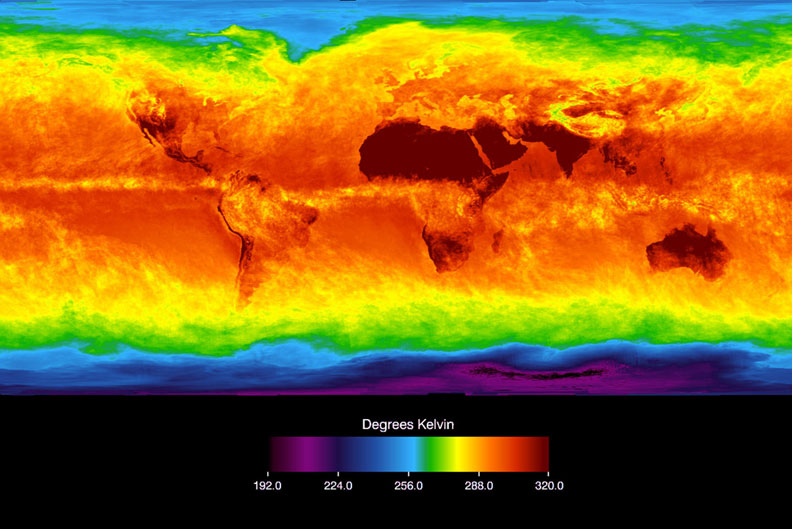
Aqua’s first year has revealed impressive views of our planet’s volatile surface, capturing dramatic events such as fires in Australia and the United States, snowstorms in the Arctic, typhoons in the East China Sea, a volcanic eruption on the island of Sicily, and dust storms in the Middle East, all with data from its six unique instruments. “We’ve collected high-quality data from all of our instruments, and these data should eventually lead to a better understanding of Earth’s water cycle and the role it plays in our changing climate,” stated Claire Parkinson, Aqua Project Scientist at NASA’s Goddard Space Flight Center, Greenbelt, Md. Aqua was launched on May 4, 2002, and soon after began providing valuable information from its massive data flow, approximately 89 gigabytes a day, allowing scientists to analyze and generate dozens of data products. The Aqua Science Team will convene at Goddard May 28-29 to present their insights, first-year results, and plans for their future research using Aqua data. The Atmospheric Infrared Sounder (AIRS), the Advanced Microwave Sounding Unit (AMSU) and the Humidity Sounder for Brazil (HSB) combine to form a trio of instruments that capture an ongoing, detailed picture of the Earth’s atmosphere that will eventually lead to improved short-term weather predictions, improved tracking of severe weather events like hurricanes, and advancements in climate studies. Arctic snowstorms were successfully tracked using data from the AMSU and the HSB, the latter having been provided by the Brazilian National Institute for Space Research. In the past, tracking snowstorms in the Arctic from satellites was particularly difficult because of the underlying ice and snow surfaces. Successful tracking with Aqua data was accomplished by using channels of the AMSU and HSB that do not see through to the surface. The European Centre for Medium Range Weather Forecasting has shown a positive impact to the weather forecasts and plans to incorporate AIRS and the AMSU data into their operational forecast models by the end of summer 2003. AIRS data already available to scientists include the most accurate, highest spectral resolution measurements ever taken from space of the infrared brightness (radiance) of Earth’s atmosphere. This information can be used to make more accurate predictions of weather and climate. More advanced data products are expected to become available later this year. The data will include atmospheric temperature and humidity profiles as well as additional environmental measurements on various types of clouds, particularly the thin veil of cirrus clouds that covers Earth. In addition, new data are expected on concentrations of greenhouse gases, such as carbon dioxide, methane, carbon monoxide and volcanic sulfur dioxide. Aqua imagery has captured numerous dramatic events of the past year. On June 24, 2002, the day that Aqua’s Moderate Resolution Imaging Spectroradiometer (MODIS) was turned on, its data were used to produce MODIS imagery of fires in Australia. MODIS also captured extensive flooding of three major river systems along the Gulf of Mexico resulting from heavy rains, dust storms in the Middle East and Mediterranean, the October 2002 eruption of Mt. Etna (also captured well by the AIRS data), and the Biscuit fires in Oregon and California in August 2002. In early June 2002, the Advanced Microwave Scanning Radiometer for the Earth Observing System (AMSR-E) produced Aqua’s first global map of sea surface temperatures. AMSR-E also recorded images of Typhoon Rammasun in the East China Sea on July 4, 2002, and Typhoon Higos approaching Japan on October 1, 2002. This instrument was provided by the National Space Development Agency of Japan. The Clouds and Earth’s Radiant Energy System (CERES) detects the amount of outgoing heat and reflected sunlight leaving the planet, providing critical information about the Earth?s radiation budget. An understanding of this budget and how clouds affect it is essential for understanding changes in our climate. In addition to the information the CERES instruments (Aqua has two) are providing about the radiation budget as a whole, CERES also reveals information about how various features, such as Hurricane Lili on October 1, 2002, affect outgoing shortwave and longwave radiation. The Aqua satellite won a 2002 Best of What’s New Award from “Popular Science” and the Aqua Science Team received the Nelson P. Jackson Aerospace Award from the National Space Club. The Humidity Sounder for Brazil (HSB) has provided valuable humidity soundings through the atmosphere, and these are being analyzed in a variety of studies. However, the HSB ceased operating on February 5, 2003, and the Aqua team continues to troubleshoot the instrument. Aqua is the latest in a series of the Earth Observing System spacecraft, following the Terra satellite launched in December 1999. Like Aqua, Terra contains a MODIS and two CERES in its instrument complement. Aqua crosses the equator 28-30 times a day, doing so at 1:30 p.m. as it heads north and at 1:30 a.m. as it heads south. The observation times contrast with the Terra satellite, which crosses the equator between 10:30 and 10:45 a.m. going south and between 10:30 and 10:45 p.m. going north. The combination of data from these two missions provides important insights into the daily variations of key scientific parameters such as snow coverage and ocean color. Aqua is an international partnership between the United States, Japan and Brazil. During its six-year mission, Aqua will collect data on global temperature variations, the cycling of water, global precipitation, evaporation, ocean productivity, land vegetation, sea ice, land ice, snow cover, and how clouds and surface-water processes affect climate. The information will help scientists better understand how global ecosystems change, and how they respond to and affect global environmental change. NASA’s Earth Science Enterprise is dedicated to understanding the Earth as an integrated system and applying Earth system science to improve prediction of climate, weather and natural hazards using the unique vantage point of space. For more information about Aqua on the Internet, visit: For information about data products from instruments mentioned above, on the Internet, visit: AIRS and AMSU Data: AMSR-E Data: CERES Images: MODIS: ### Cynthia M. O’Carroll |
|
NASA's Aqua Satellite Marks One Year of Viewing Earth

News Date:
Thursday, May 29, 2003
News Type:
News Link:
https://aqua.nasa.gov/newsroom/nasas-aqua-satellite-marks-one-year-viewing-earth