


- Operating instruments: AIRS, AMSU, CERES, and MODIS.
- Current life expectancy: Aqua has a strong chance of operating successfully into September 2026.
- Current systems issues: None.
- Data access: The processed Aqua data are available through several NASA data centers identified on the images and data page.
- The Aqua data are also transmitted via direct broadcast, from which they can be processed for real-time applications using technologies and algorithms available from the NASA Direct Readout Laboratory (DRL).
- Greater detail on the status of the Aqua spacecraft, instruments, and other aspects of the mission are presented in a PDF Aqua Status file, updated monthly.
- View past Aqua Status files here.
Aqua Earth-Observing Satellite Mission
Aqua is currently in 'free-drift'!
What is its past, current and future altitude and equator crossing time?
Drag your cursor over the graph below to find out!
Due to fuel limitations, Aqua completed the last of its drag makeup maneuvers in December 2021 and is now in a free-drift mode, slowly descending below the A-Train and drifting to later equatorial crossing times, and lower altitudes. In Fall of 2026, passivation of the aircraft will begin.
Aqua data users have expressed the need for weekly updates on Aqua’s equator crossing time (in Mean Local Time [MLT]), as well as orbital altitude. Starting this month, we’ll be adding this information to the Aqua homepage and updating it weekly using data provided by the Operations Team. Move your cursor over the chart below to view both Aqua’s Mean Local Equator Crossing Time in UTC (dark black line) and orbital altitude (grey line) for each month through 2027.
On May 4th, 2026 Aqua will celebrate its 24th year of Earth Science data collection with 126,000+ orbits of the Earth, which has enabled 30,000+ scientific publications, multiple scientific discoveries and data products used for numerous societal applications!

Latest News from the Aqua Mission
View Past News Highlights here
May 28, 2025
'Ocean darkening' a cause for concern - scientists
A BBC news article came out today that shows that the Earth's oceans are becoming darker this was discovered using NASA Aqua and Terra MODIS data.
Dr Thomas Davies, associate professor of Marine Conservation at the university, said: "There has been research showing how the surface of the ocean has changed colour over the last 20 years, potentially as a result of changes in plankton communities.
"But our results provide evidence that such changes cause widespread darkening that reduces the amount of ocean available for animals that rely on the sun and the moon for their survival and reproduction."
 "Since its launch more than two decades ago, the Aqua mission has delivered observations essential to improving our understanding of global dynamics and processes occurring on the land and cryosphere, the oceans, and the atmosphere. Furthermore, the Aqua mission has addressed topics of national priority such as weather forecasting, homeland security and defense, and natural resource management [...] Aqua is one of the most highly successful Earth observing satellites ever to have orbited our planet [...] As the Aqua satellite celebrates its 20th year in space, its contributions continue to advance our knowledge of Earth's systems for the benefit of humanity.”
From the citation of the USGS Pecora 2022 Group Award to Aqua.
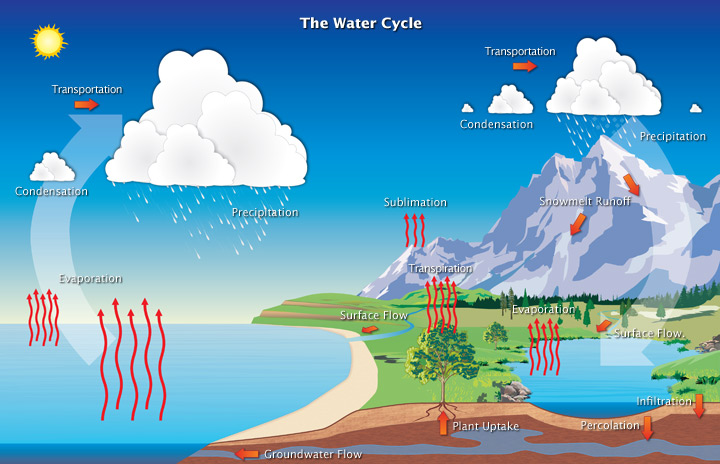
Aqua, Latin for water, is a NASA Earth Science satellite mission named for the large amount of information that the mission is collecting about the Earth's water cycle, including evaporation from the oceans, water vapor in the atmosphere, clouds,precipitation, soil moisture, sea ice, land ice, and snow cover on the land and ice. Additional variables also being measured by Aqua include radiative energy fluxes, aerosols, vegetation cover on the land, phytoplankton and dissolved organic matter in the oceans, and air, land, and water temperatures.
The Aqua mission is a part of the NASA-centered international Earth Observing System (EOS). Aqua was formerly named EOS PM, signifying its afternoon equatorial crossing time. A timeline of Aqua on-orbit progress through the initial 120 day check-out period can be found here.
Aqua was launched on May 4, 2002, and has six Earth-observing instruments on board, collecting a variety of global data sets. Aqua was originally developed for a six-year design life but has now far exceeded that original goal.
It continues collecting and transmitting high-quality data from four of its six instruments:
Atmospheric Infrared Sounder (AIRS),
Advanced Microwave Sounding Unit (AMSU),
Clouds and the Earth’s Radiant Energy System (CERES),
Moderate Resolution Imaging Spectroradiometer (MODIS),
Advanced Microwave Scanning Radiometer for EOS (AMSR-E), suffered a major anomaly in October 2011 and ceased its high-quality data transmission at that time. Later the instrument was turned back on, and it transmitted reduced quality data important for intercalibration purposes before being powered off in March 2016.
Humidity Sounder for Brazil (HSB), collected approximately nine months of high quality data but failed in February 2003.
Aqua was the first member launched of a group of satellites termed the Afternoon Constellation, or sometimes the A-Train.
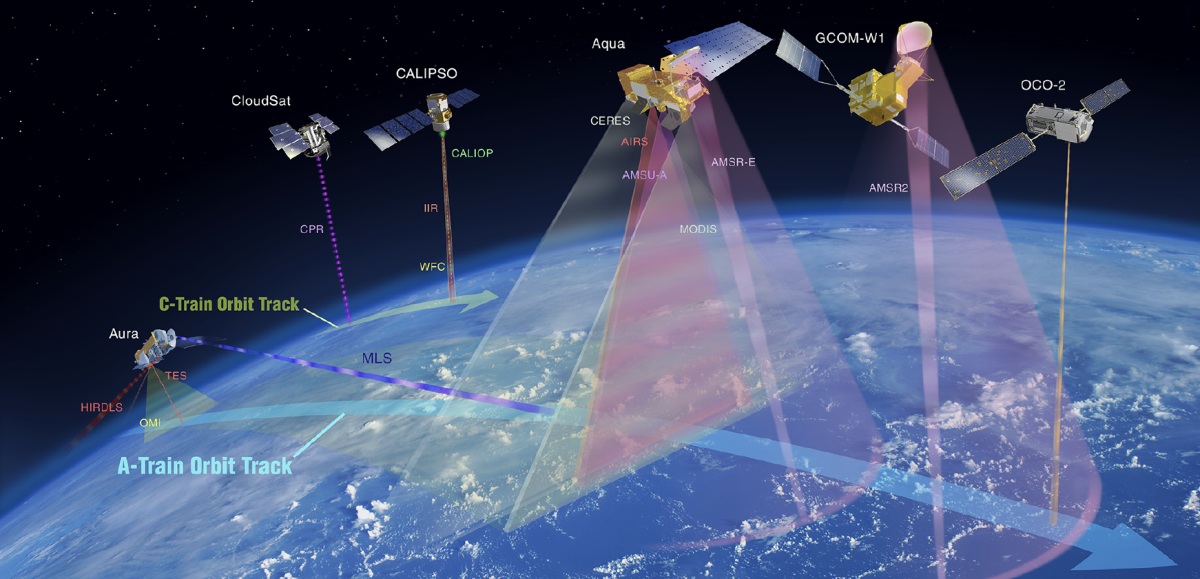
1.) Aqua, launched in May 2002
2.) Aura, launched in July 2004
3.) PARASOL, launched in December 2004 and completed its mission and exited the A-Train in December 2013.
4. & 5.) CloudSat and CALIPSO, launched in May 2006, and
6.) GCOM-W1, launched in May 2012
7.) OCO-2, launched in July 2014
When OCO-2 was launched, it the A-Train, followed by GCOM-W1, Aqua, CALIPSO, CloudSat, and Aura. By early 2022, CloudSat, CALIPSO, and Aqua had all exited the A-Train. Due to fuel limitations, Aqua completed the last of its drag makeup maneuvers in December 2021 and is now in a free-drift mode, slowly descending below the A-Train and drifting to later equatorial crossing times.
Aqua Image Highlight
Aqua Status
Aqua Video Podcast Series
A series of five video podcasts (i.e., vodcasts) have been produced by NASA Goddard TV in conjunction with Aqua mission personnel.
- Vodcast 1, Introducing the Aqua Mission, viewable at the NASA Goddard YouTube channel and NASA Scientific Visualization Studio
- Vodcast 2, Aqua AIRS: Visions of Weather and Climate, viewable at the NASA Goddard YouTube channel and NASA Scientific Visualization Studio
- Vodcast 3, Aqua AMSR-E: Scanning Earth's Water Cycle, viewable at the NASA Goddard YouTube channel and NASA Scientific Visualization Studio
- Vodcast 4, Aqua MODIS: Science and Beauty, viewable at the NASA Goddard YouTube channel and NASA Scientific Visualization Studio
- Vodcast 5, Aqua CERES: Tracking Earth's Heat Balance, viewable at the NASA Goddard YouTube channel and NASA Scientific Visualization Studio
Aqua Science of the Month
August 2025
Greener green and bluer blue: Ocean poleward greening over the past two decades
- Haipeng Zhao et al., Greener green and bluer blue: Ocean poleward greening overe the past two decades. Science, 388, 1337-1340 (2025). https://www.science.org/doi/10.1126/science.adr9715
This study used 20 years of Aqua data, specifically the ocean color data product from MODIS which shows the Chlorphyll a concentrations, to assess the change in ocean color due to climate change. They found that the oceans were becomming greener at higher latitudes, and bluer near the equator. This is caused by warming ocean temperatures where the ideal temperatures for primary production (chlorophyll a) have moved north from the equator. This change in ocean color and chrlophyll a concentrations in our global oceans have a large impact on the fisheries and economies of coastal nations.

Figure Caption: Global distribution and latitudinal trends of surface Chl at 2° resolution.
(A) Climatological mean Chl between 60°S and 60°N (2003–2022) and north of 60°N (2003–2020). Coastal regions and areas south of 60°S are excluded. (B) Median of the climatological Chl (thick line) and the 10th and 90th percentiles (thin lines) as a function of latitude. (C) Annual Sen’s slope of the climatological Chl with Mann-Kendall (MK) test significance (°P < 0.1, *P < 0.05, **P < 0.01, ***P < 0.001) indicated. Color represents R2 (coefficient of determination) values.
See older science highlights here.